
Advanced Functions and Modeling is an alternative to PreCal course. And this year I choose to move the Descriptive Stats unit from the very first unit in August to the first unit of the second semester in January. Our Stats unit is very simplistic as it is meant to be an introduction of sorts. Tt contains the same content from CCM1: Measures of center, calculating 5-number summaries and outliers, creating histograms and box plots. We choose to have the unit focus on arguing with data rather than purely analyzing data.
Arguing with data, for the purposes of the class is when students are given data, a side-by-side box plot, or multiple histograms on the same scale and then they need to:
- Make a claim–students need take a stance for the data given. We modeled these statements to reflect the thesis statement construction from their US History class (which most students are in).
- Provide three supporting statements for the claim. Each statement should be data driven and assist your claim.
The Lab was inspired stolen from an image I found on Twitter. I can’t find the source, most likely someone in #MTBoS.
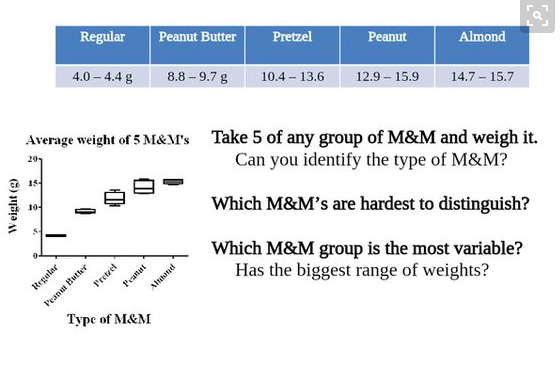
And I figured this was a lab that could be easily recreated for my students. I, with the help of my loving husband, created “Mystery Morsel” packs. We created packs made from large index cards that we put 5 M&Ms in and sealed. We made 7 packs for each type of M&M.
Students were tasked with identifying the “Mystery Morsels” by using their weights. Each group was given a control baggie of M&Ms to come up with a baseline for each type. They shared their data on the board for weights of their M&Ms and then proceeded to weigh the “Mystery Morsels”:
Was it a perfect lab? Heck no. I think it was far too easy and there are many things I want to change for next year. Several kids noted that “it was obvious” which M&M goes to which pack because the weights are varied. One student mentioned that it would be “evil if Mrs. White hid skittles in here somewhere. I bet they weigh about the same as the plain ones.”
Which got me to thinking…skittles…yes. And Reese’s Pieces. And maybe one random packet that has 6 M&Ms instead of 5.
My rational for this “trickery” is to have some of the box plots overlap in the range of the data. So students actually have to use their knowledge of measures of center/variability to rationalize their decisions for which of the “Mystery Morsels” belong to which M&Ms and which are “other” candies.

Love your language of “arguing” with data rather than just analyzing data. This puts your students in an active role – plus teenagers do love to argue! This seems like an excellent activity. It may not have been a perfect lab, but they never are the first time. Please do let us know if you find more overlap with skittles weights to make this more challenging or if you revise it for next year. Thanks for sharing this.
I think that this may have come from an Oregon State U activity? It looks like the “Chemical Conundrum” http://ehsc.oregonstate.edu/downloadactivities – it looks like there are some more nice ideas there too.
LikeLike